

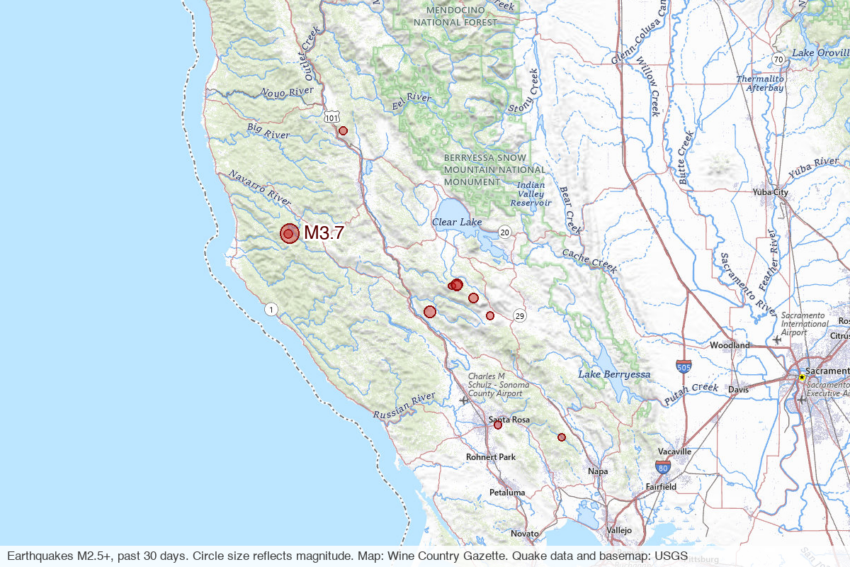
Every earthquake of magnitude 2.5 or greater recorded over the past 30 days in and around the North Bay — Sonoma, Mendocino, Lake and Napa counties, plus bordering areas and offshore waters — drawn directly from the U.S. Geological Survey’s live feed. This page checks for new data every five minutes; all times are Pacific.
Last updated October 4 at 12:02 a.m. Pacific.
Most recent: magnitude 3.0, 5 miles ESE of Cloverdale, September 30 at 2:07 p.m., 2.5 miles deep.
The U.S. Geological Survey recorded 11 earthquakes of magnitude 2.5 or greater in the region over the past 30 days. The largest was a magnitude 3.7, 6 miles W of Boonville, on September 25.
| Date and time | Magnitude | Location | Depth | Details |
|---|---|---|---|---|
| September 30 at 2:07 p.m. | 3.0 | 5 miles ESE of Cloverdale | 2.5 miles | USGS |
| September 30 at 1:48 p.m. | 2.6 | 1 mile SW of Anderson Springs | 1.1 miles | USGS |
| September 29 at 9:06 a.m. | 2.6 | 4 miles W of Yountville | 5.2 miles | USGS |
| September 27 at 12:10 p.m. | 2.6 | 6 miles NW of Redwood Valley | -0.2 miles | USGS |
| September 25 at 9:02 p.m. | 2.7 | 6 miles W of Boonville | 2.1 miles | USGS |
| September 25 at 8:42 p.m. | 3.7 | 6 miles W of Boonville | 3.0 miles | USGS |
| September 15 at 6:40 p.m. | 2.6 | 2 miles ESE of Santa Rosa | 6.3 miles | USGS |
| September 12 at 11:39 a.m. | 2.8 | 2 miles W of Cobb | 0.9 miles | USGS |
| September 10 at 1:36 p.m. | 3.0 | 6 miles WNW of Cobb | 0.6 miles | USGS |
| September 10 at 1:36 p.m. | 2.8 | 6 miles WNW of Cobb | 1.0 miles | USGS |
| September 9 at 12:12 p.m. | 2.6 | 7 miles WNW of Cobb | 1.3 miles | USGS |
The faults beneath the North Bay
The Rodgers Creek fault runs beneath Santa Rosa and is the northern continuation of the Hayward fault system; the USGS ranks it among the Bay Area faults most likely to produce a major earthquake. Its northern extension, the Maacama fault, follows the Highway 101 corridor through Hopland, Ukiah and Willits and produces frequent small quakes. The San Andreas fault lies offshore along the Sonoma and Mendocino coast, coming ashore near Point Arena — the stretch that ruptured in 1906.
The Geysers geothermal field, straddling the Sonoma–Lake county line, generates thousands of small quakes a year tied to steam-field operations. Most fall below the magnitude 2.5 floor of this table, which is why Cobb and Anderson Springs appear here only when a larger one hits.
The region’s most damaging recent earthquake was the magnitude 6.0 South Napa earthquake of August 2014.
Frequently asked questions
I felt a quake — why isn’t it listed?
Three common reasons: it was smaller than magnitude 2.5, it was centered outside the four-county area, or it happened in the last few minutes and hasn’t reached the USGS feed yet. USGS also revises magnitudes and locations as seismologists review the data.
How big does an earthquake have to be to feel it?
Magnitude 2.5 to 3 is about the threshold most people notice near the epicenter. Damage generally starts above magnitude 5.5, depending on depth and distance.
Where does this data come from?
The U.S. Geological Survey’s public real-time earthquake feed. Each row links to the USGS event page, which carries maps, shaking reports and any later revisions.
What should I do when the ground starts shaking?
Drop, cover and hold on. If you’re in bed, stay there and cover your head. Move away from windows; don’t run outside while the shaking continues.
This page is generated automatically from public U.S. Geological Survey earthquake data. No generative AI is used; every figure comes directly from the public record.